

On February 28, 2026, U.S. and Israeli forces launched Operation Epic Fury, a coordinated strike campaign against Iran. In retaliation, Iran’s Islamic Revolutionary Guard Corps (IRGC) announced the closure of the Strait of Hormuz. While global attention initially focused on the surge in oil and natural gas prices, a quieter but equally consequential shock was unfolding in the fertilizer markets.
Price Impact and Transmission Mechanism
What makes Hormuz uniquely dangerous compared with other checkpoints is the near-total absence of bypass infrastructure for non-oil commodities. Saudi Arabia’s East-West Pipeline can reroute crude oil up to 7 million barrels per day to the Red Sea port of Yanbu, and the UAE’s Habshan-Fujairah pipeline adds another 1.5-1.8 million barrels per day outside the strait. However, these infrastructures are for oil only, supplies of other commodities from the Gulf region have effectively vanished from the market over the past few months, including fertilizer. In fact, WTO recorded a 99% decline of fertilizer-related outbound shipments passing through the Strait of Hormuz.
Fertilizer-related Outbound Shipments through the Strait of Hormuz to Destinations outside the Persian Gulf (AIS-Traceable Vessels Only)

Source: World Trade Organization, Strait of Hormuz Trade Tracker (2026). Data based on AIS-traceable vessels only (May 26, 2026)
This supply imbalance was quickly reflected in the fertilizer market. The following table presents the price changes of the representative products across the three types of fertilizers categories after the strait closure, with Brent crude oil included as a reference benchmark.
Iran Conflict Impact on Fertilizer (N · P · K) and Energy | Feb 27 – May 2026
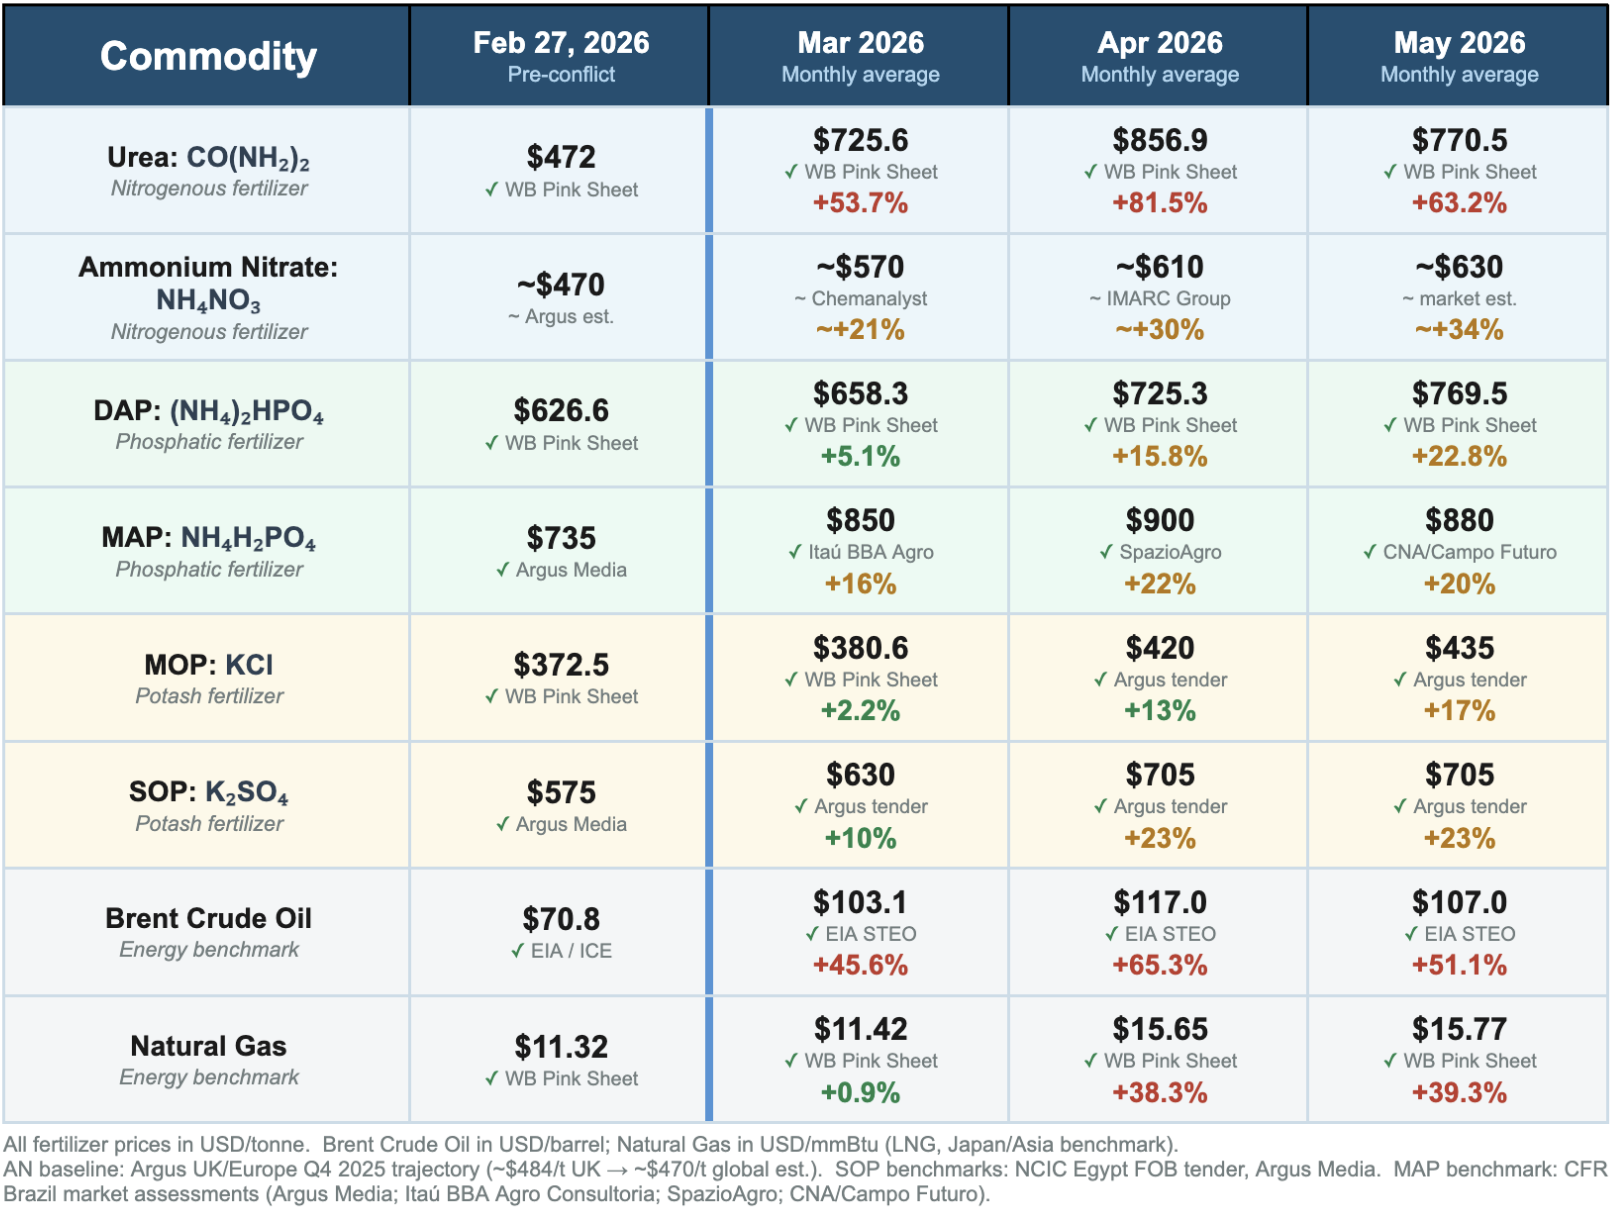
Sources: World Bank Pink Sheet (Jun 2026 edition, reflecting Mar–May 2026 data); EIA STEO (Jul 2026 edition); Argus Media; Itaú BBA Agro Consultoria (Mar 2026); SpazioAgro (Apr 2026); CNA/Campo Futuro — Sistema CNA/Senar (May 2026); IMARC Group (Apr 2026); Chemanalyst (Q1 2026).
An asymmetric trend across fertilizers can be observed: nitrogen prices surged the most, phosphate prices rose more gradually, and potash prices responded with a delay. This reflects the distinct supply-chain structure across fertilizer types.
The most affected nitrogenous fertilizers (urea, ammonium nitrate, UAN, and CAN) are distinct end-products, but their supply chains converge at a common upstream chokepoint: ammonia synthesis via the Haber-Bosch process, described here:
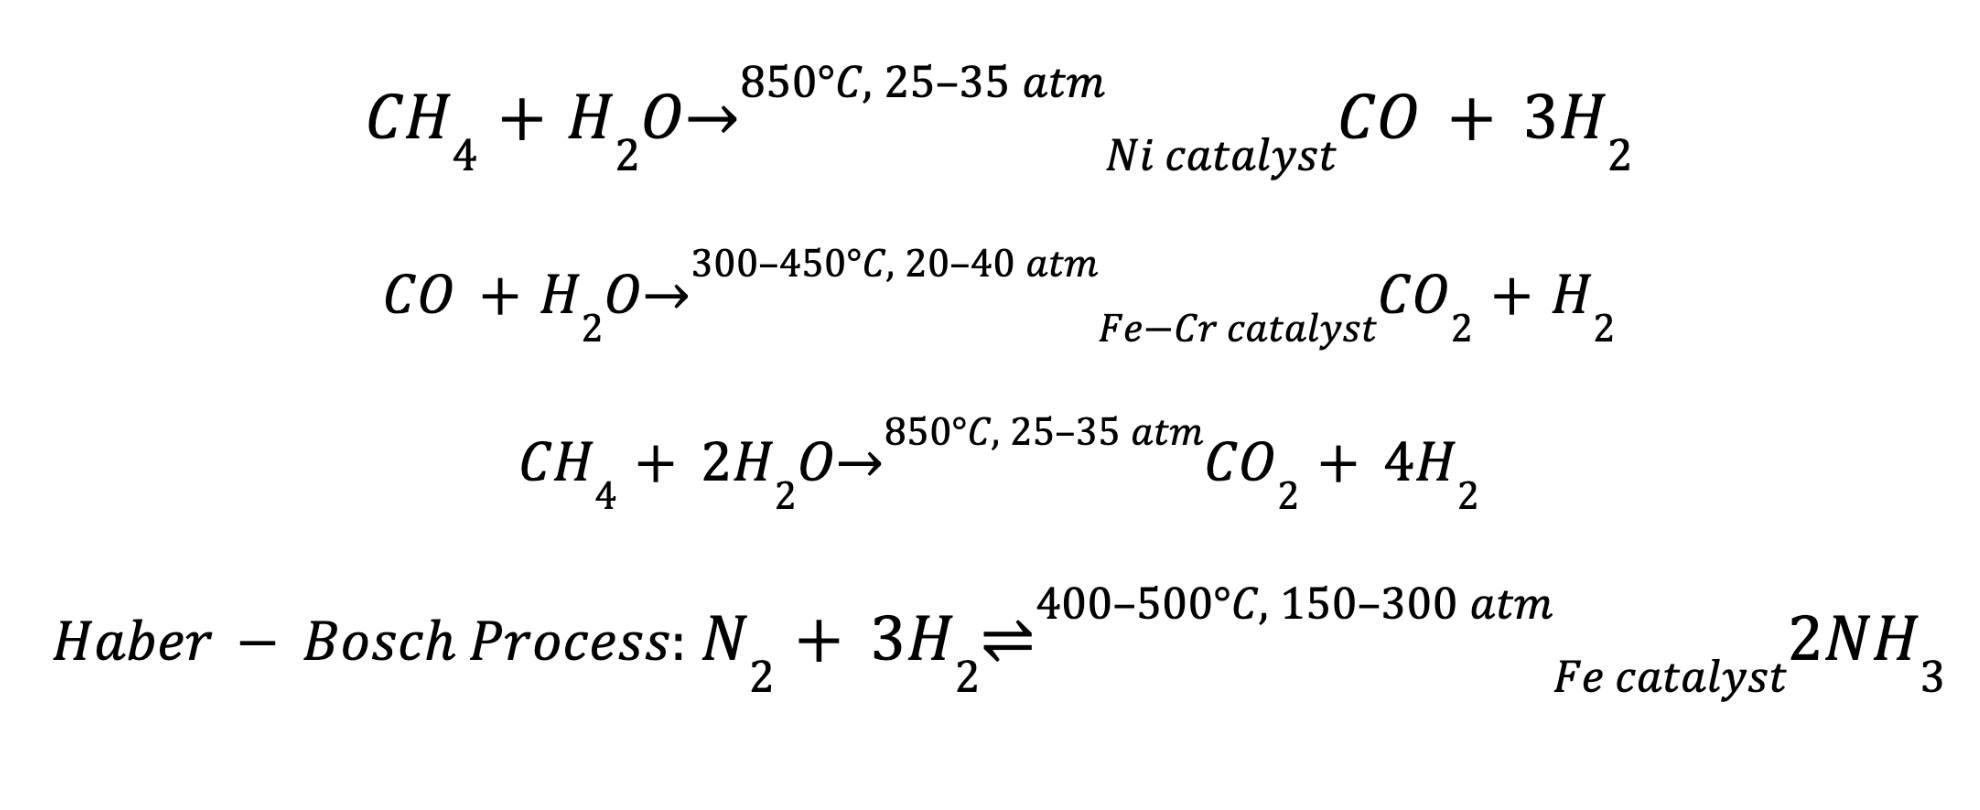
Natural gas serves as both the energy source and primary chemical feedstock for nitrogenous fertilizers, making the Gulf region an ideal production location due to its abundant natural gas resource.
About 30%-35% of global urea is directly supplied by the Gulf region, together with 20% to 30% of ammonia (NH3) and about 20% of liquefied natural gas (LNG). (FAO, 2026a; IEA, 2026) As a result, the conflict disrupted both direct and indirect supply channels simultaneously, creating strong upward pressure on nitrogenous fertilizer prices through the loss of finished fertilizer exports from the Gulf and reduced availability of ammonia and LNG inputs for producers elsewhere.
As for phosphatic fertilizers, the production process involves three key inputs: phosphate rock ( (Ca3PO4 )2 ), sulfuric acid (H2SO4) and ammonia (NH3). Phosphatic end-products such as DAP are differentiated by adjusting the ammonia added during ammoniation.
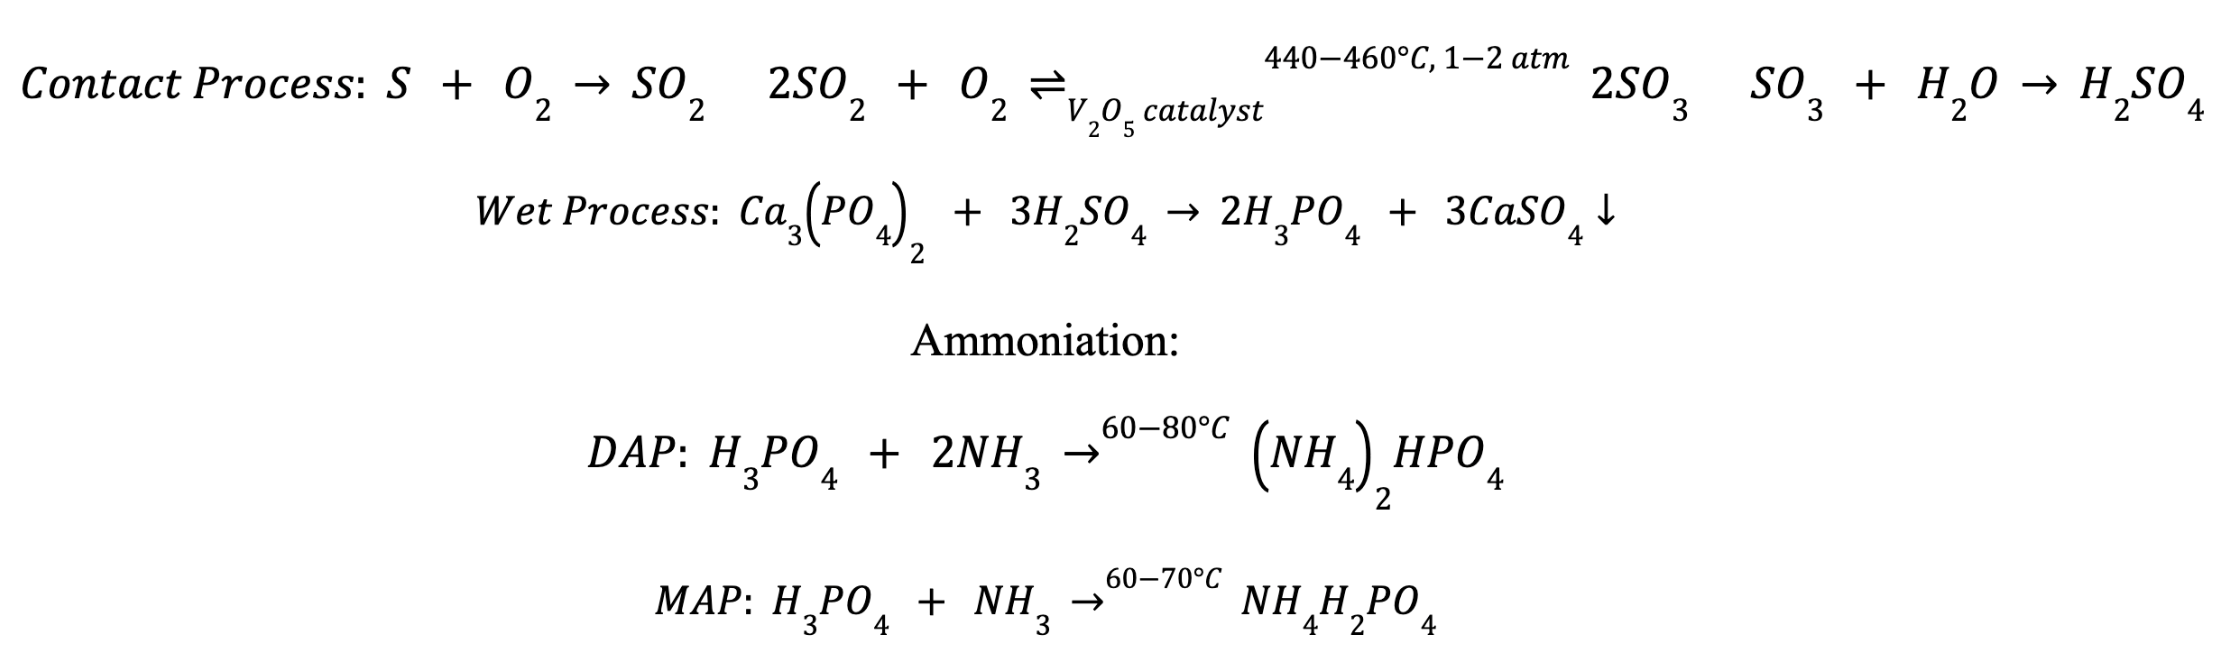
Regional tensions mainly increased the cost of sulphur. About 47% of global seaborne sulphur trade originates from Persian Gulf countries because sulphur is a by-product of oil and gas refining. (McDonald and Jeffrey, 2026)
Although sulphur costs rose significantly around the world, the increase in phosphatic fertilizer prices was relatively moderate because sulphur is only one of several raw materials and accounts for about 20% of total phosphatic fertilizer production costs. (The Mosaic Company, 2025) In addition, large phosphatic fertilizer producers such as China and USA source sulphur domestically, and the price transmission may be slower because of some long-term supply contracts. (U.S. Geological Survey, 2025; Itafos Inc., 2026)
Potash fertilizer initially remained relatively price-stable, mainly because its major producers — Canada (30.6%), Russia (20.4%), and China (12.9%) — are geographically distant from the Gulf region. (Mineral commodity summaries 2026, 2026) However, as the situation in the Middle East intensified, potash prices were indirectly affected and started to rise. For example, according to the United Nations Conference on Trade and Development (2026), oil-tanker freight rates increased by more than 90% since late February, while bunker fuel price had nearly doubled. In addition, a large share of global potash trade moves under big periodic benchmark contracts (India and China settlements), which are repriced infrequently and therefore create a lag in price transmission. (ICIS, 2023) According to pre-conflict estimates by Nutrien, the world’s largest potash producer, the demand for potash fertilizer is still expected to increase (White, 2026).
Reflection of Ukraine-Russia War
In 2022, Russia invaded Ukraine, the price of fertilizers rose dramatically. The table below presents a comparable price trajectory for the 2022 shock.
Russia–Ukraine War Impact on Fertilizer (N · P · K) and Energy | Q4 2021 – Q4 2022, Benchmarked Against the Apr 2026 Hormuz Crisis
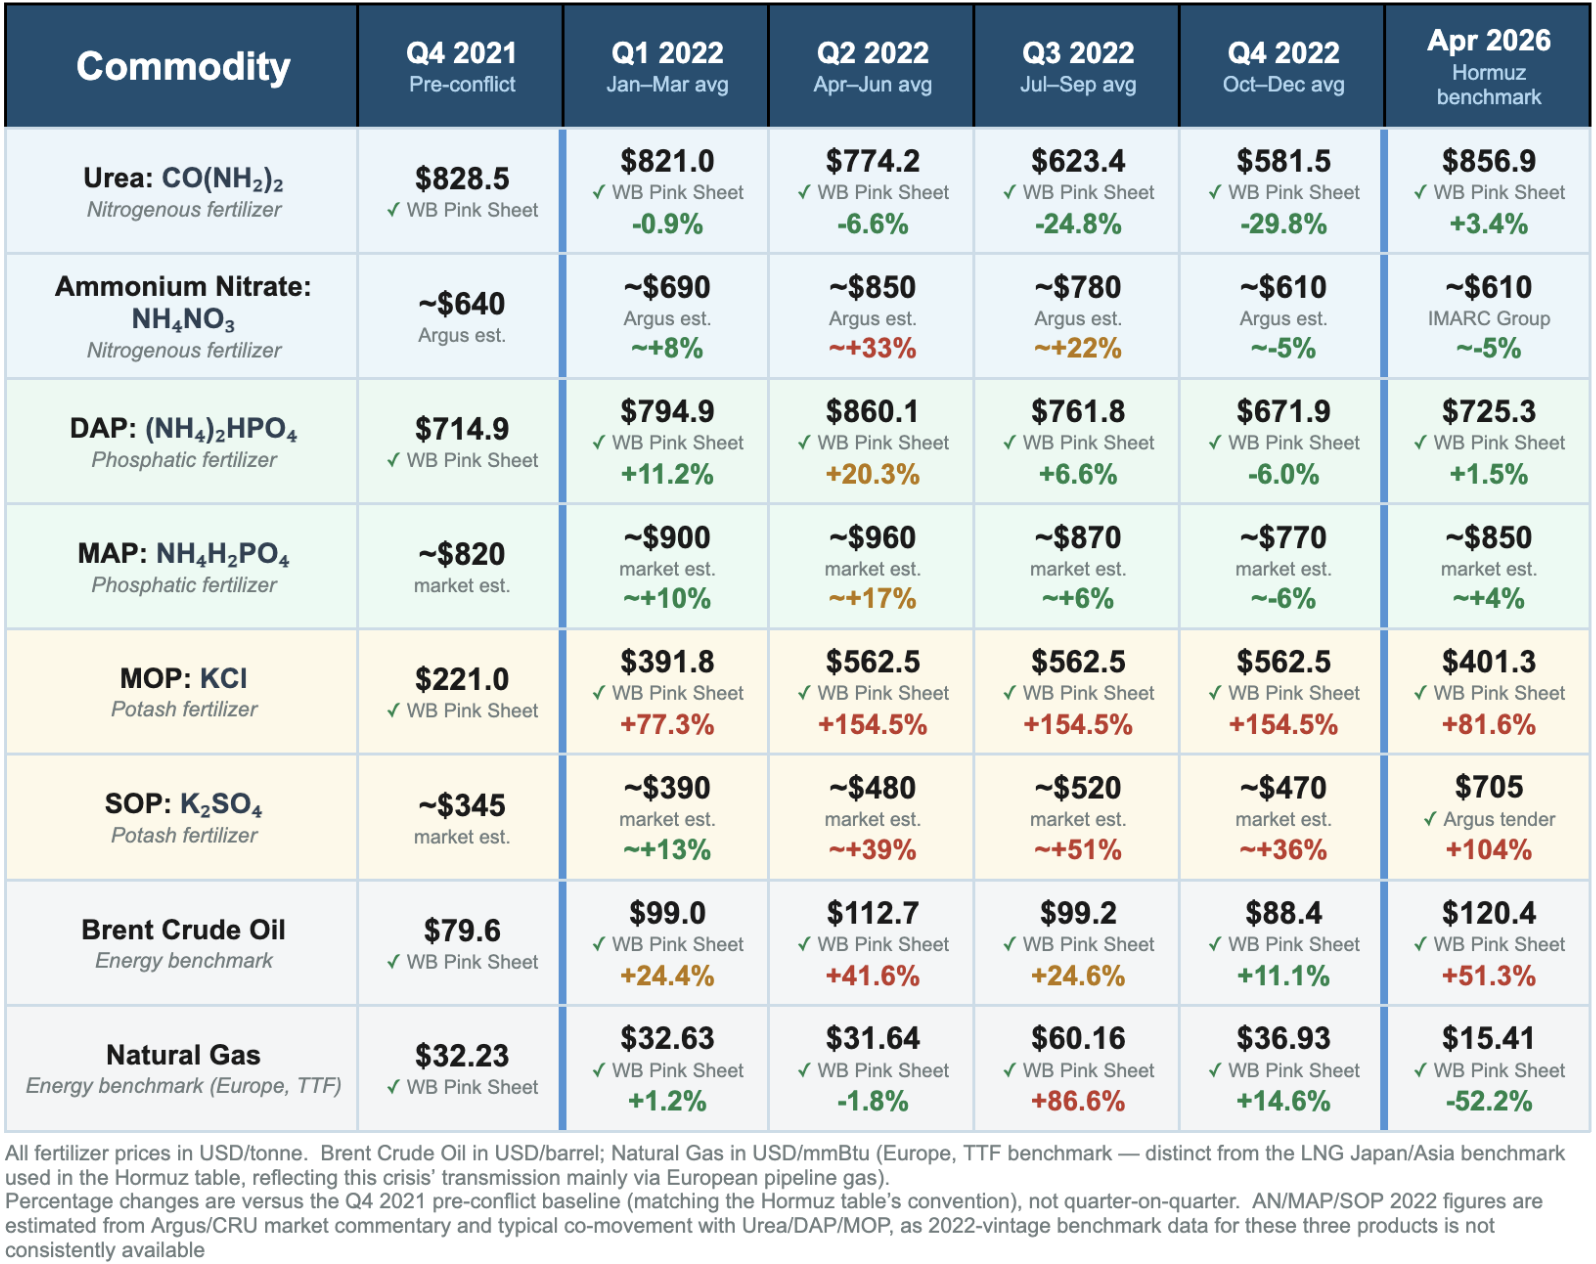
Sources: World Bank Pink Sheet (Jan 2022, Apr 2022, Sep 2022, Dec 2022 and Jan 2023 editions); Argus Media; CRU.
Before the conflict, Russia accounted for about 16% of world urea exports, 12% of phosphate exports and together with Belarus, 40-41% of potash exports (Kee, Cardell and Zereyesus, 2023). Although Russian fertilizers themselves were exempted from western sanctions, the EU committed to phasing out Russian energy (European Commission, 2022b), creating a supply-chain cost transmission mechanism similar to that of the Hormuz closure. In fact, around 70% of European ammonia production had been paused in August 2022, because natural gas accounts for up to 80% to 90% of the variable cost of producing ammonia (European Commission, 2022a). Moreover, although nominally unsanctioned, Russian fertilizers faced actual trade barriers: the Russian Agricultural Bank was excluded from the SWIFT system, exporters struggled to receive international fertilizer payments (Liboreiro, 2025) and European buyers grew less willing to purchase from Russia amid public pressure, compliance and supply uncertainty. As a result, a large proportion of Russia’s production capacity was redirected at discounted prices to countries such as India, China and Brazil. (Rajendra Jadhav, 2022)
Both crises removed a major supplier from established trade flows and disrupted supply chains, thereby pushing up prices. Yet whereas Russian energy and fertilizer could still be rerouted to alternative buyers at discounted prices, redistributing global supply rather than destroying it, the closure of Hormuz offers no such safety valve.
Consequences
Sub-Saharan Africa, with Sudan at the extreme, is the region most severely affected by the price increase in humanitarian terms. According to UNCTAD’s statistics (2026), Sudan is the most Gulf-dependent fertiliser importer in the world, sourcing 54% of its fertilizer imports, followed by Tanzania (31%), Somalia (30%) and Kenya (26%). Beyond the level of exposure, this region’s current sensitivity to external shocks is the fundamental reason why it bears the greatest humanitarian cost. Sub-Saharan Africa is already applying low levels of fertiliser — around 22 kg/ha, compared to the global average of 146 kg/ha. (Malpass, 2022) This stands in sharp contrast to the urgent, survival-driven demand for food. It is especially difficult for this region to cope with the shock given the fragile financial situation of both governments and households, with about 50% of the population employed in agriculture (World Bank, 2026b), the region is still struggling to feed itself. As a result, a price shock that would merely raise costs elsewhere risks tipping the region into an outright humanitarian crisis. Sudan illustrates the severity of this impact. According to the latest Integrated Food Security Phase Classification (IPC) analysis (Food and Agriculture Organization of the United Nations, 2026b), there are nearly 19.5 million people (41% of Sudan’s population) currently facing at least IPC Phase 3, which means households are either already facing food consumption gaps with elevated malnutrition, or may have to sell their productive assets to close those gaps (Integrated Food Security Phase Classification (IPC), n.d.). Moreover, there are more than 5 million people in Phase 4 (Emergency) and nearly 135,000 people in Phase 5 (Catastrophe), and the situation is expected to worsen during the upcoming June–September lean season (Integrated Food Security Phase Classification (IPC), 2026).
In fiscal terms, no economy is more exposed than India. Its vulnerability is of a different nature, where the shock is felt not by farmers’ stomachs but by the nation’s balance sheet. Fertilizers are heavily subsidised by the government, constituting the second largest subsidy item in India’s central budget, whose cost moves with fertilizer prices as well through higher input costs (Gulati and Juneja, 2025). For example, the maximum retail price of a 45kg bag of urea fertilizer is statutorily fixed at Rs 242, with the margin subsidised by the government (India. Ministry of Chemicals and Fertilizers, 2024). In fact, India is the third largest-largest importer of fertilizers in absolute terms, while roughly one third of its imports are from the Gulf region (Statista, 2025; World Bank, 2024). Its indirect exposure is equally significant: before the conflict, 74.2% of India’s natural gas import was from the Gulf region (The Wire Staff, 2026), which is heavily consumed during fertilizer production process. Reflecting these pressures, India’s fertiliser ministry has asked for a 100 percent increase in subsidy from Rs 1.7 trillion (approximately 18 billion USD) to Rs 3.4 trillion (approximately 36 billion USD). (Wani and Kothari, 2026) This mirrors the experience of 2022, when the Russia–Ukraine war caused a comparable disruption to fertilizer supply chains and the budgeted allocation of Rs 1.05 trillion ultimately rose to Rs 2.55 trillion (PRS Legislative Research, 2022), and the fiscal deficit closed the year at 6.4% of GDP (Das, 2023). India’s fiscal deficit target of 4.3% of GDP for FY2026-27 was set on 1 February, before the closure of the strait could have been anticipated (India. Ministry of Finance. Press Information Bureau, 2026). The full impact of the fertiliser shock on India’s economy remains unclear, but it is already straining public finances in ways the February budget could not have priced in.
Counterintuitively, the world’s largest importer of fertilizer, Brazil, has so far been among the least affected countries. On paper, its exposure seems extreme. Unlike the USA, which ranks second yet still meets roughly 60% of its NPK demand through domestic production, Brazil produces little of the fertilizer it consumes. Of the 49.1 million tons used annually, 45.5 million tons, or over 90%, are imported. (Lennon, 2025; Samora, 2026) Specifically, as the following figure shows, the dependence runs across all three primary nutrients.
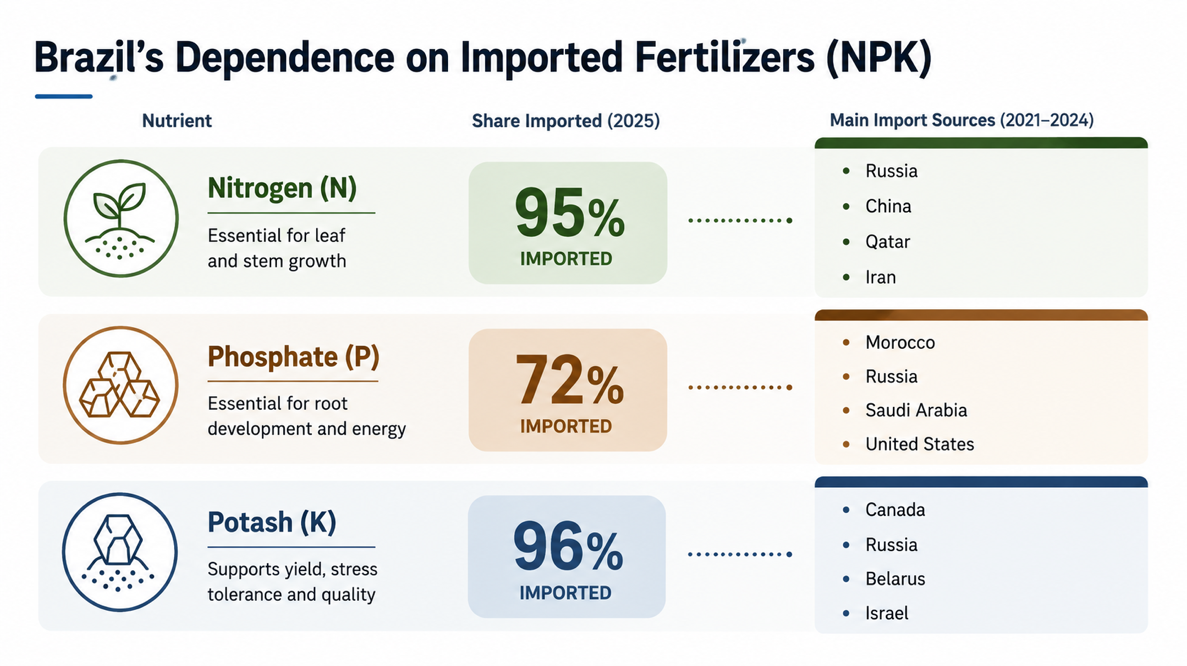
Source: Colussi, J. and Langemeier, M. (2026) ‘Middle East Conflict Revives Concerns Over Fertilizer Dependence in the U.S. and Brazil’, farmdocDAILY, 16, no. 68.
Despite the high level of import dependency a price surge has not materialised.
Brazil’s Domestic Fertilizer Prices (N · P · K) | Feb – May 2026

Source: Formigoni, I. (2026a) ‘Preço do cloreto de potássio, ureia e MAP entre fevereiro de 2025 e 2026’, Farmnews, 16 March; Formigoni, I. (2026b) ‘Preço da ureia dispara em março de 2026, mas em 12 meses o cloreto de potássio subiu mais!’, Farmnews, 16 April; Formigoni, I. (2026c) ‘Importação de ureia pelo Brasil no menor valor para abril em 7 anos’, Farmnews, 13 May; Formigoni, I. (2026d) ‘Importação de cloreto de potássio pelo Brasil cai em maio, mas segue recorde em 2026’, Farmnews, 16 June; Formigoni, I. (2026e) ‘Importação de ureia pelo Brasil despenca em maio: dados de 2018 a 2026’, Farmnews, 14 June; AgFeed, ‘Preços dos fertilizantes sobem no “day after” dos bombardeios no Oriente Médio’, 2 March 2026; Itaú BBA Agro Consultoria, cited in CNN Brasil, 26 March 2026; SpazioAgro, ‘Panorama Semanal do Mercado de Fertilizantes’, 27 April 2026; CME Group, MAP CFR Brazil futures settlements (May 2026).
What shields Brazil from the price spike is its supply chain structure. Brazilian imports are mainly sourced from Canada, Russia, China, Belarus and Morocco (Colussi et al., 2026; Colussi and Langemeier, 2026), all of which deliver through routes that bypass the Strait of Hormuz. Notably, this structure is itself the legacy of the previous global fertilizer shock mentioned above. For example, since the outbreak of the Russia–Ukraine war, Russia has consolidated its position as Brazil’s largest supplier, accounting for 25.9% of total fertilizer imports. (Malheiros, 2026)
However, another country with a similar level of import dependence to Brazil has not been as fortunate. Australia used around 8.7 million tonnes of fertilizer in 2024, with more than 85 per cent being imported, a substantial share of which transited the Strait of Hormuz (Revell, 2026). According to Australian Bureau of Agricultural and Resource Economics and Sciences (ABARES) (2026), 57% of Australia’s urea imports bypass the Strait, together with 30% of DAP and 28% of MAP. This situation has caused a significant surge in fertilizer prices in Australia, with urea being the most affected product:
Australia’s Fertiliser Prices and Hormuz Import Exposure (Taking Urea as an Example) | Feb 27 – May 2026

Source: GrainGrowers, ‘Fertiliser Report’, 27 February; 13 March; 10 April; 24 April; 8 May; 22 May 2026 (all citing Argus Media assessments); Australian Bureau of Agricultural and Resource Economics and Sciences (ABARES) (2026) Fertiliser dashboard (see Reference List).
What makes matters worse is that Australia has a reversed season compared with the Northern Hemisphere, which means its winter crop is sown from April to June, urea top-dressing runs from July to August. On a five-year average, only around 16 per cent of a typical year’s volume had been landed by the end of March, with most of the fertiliser needed for the winter cropping season due to arrive over the next few months (Whitelaw, 2026). The price surge from March to May therefore occurred at the least favourable point in this cycle; after summer stocks had been depleted but before the seasonal import build could be completed.
References
Argus Media (2026) Argus Fertilizer: Argus Media. Available at: https://www.argusmedia.com/en/commodities/fertilizers (Accessed: 26 May 2026).
Australian Bureau of Agricultural and Resource Economics and Sciences (ABARES) (2026) Fertiliser dashboard: Department of Agriculture, Fisheries and Forestry. Available at: https://www.agriculture.gov.au/abares/data/fertiliser-dashboard (Accessed: 24 August 2026).
Colussi, J. and Langemeier, M. (2026) ‘Middle East Conflict Revives Concerns Over Fertilizer Dependence in the U.S. and Brazil’, farmdocDAILY, 16, no. 68.
Colussi, J., Schnitkey, G., Schnitkey, G. and Paulson, N. (2026) ‘The Iran Conflict and Fertilizer Markets: Why Brazil Faces Greater Near-Term Risk than the U.S.’, farmdocDAILY, 16, no. 62.
Das, B. (2023) ‘Centre’s fiscal deficit narrows down to 6.4% of GDP, meets set budgeted target’, Business Today, 31 May 2023. Available at: https://www.businesstoday.in/latest/economy/story/centres-fiscal-deficit-narrows-down-to-64-of-gdp-meets-set-budgeted-target-383647-2023-05-31 (Accessed: 8 July 2026).
European Commission (2022a) Ensuring availability and affordability of fertilisers. Brussels.
European Commission (2022b) REPowerEU. Available at: https://commission.europa.eu/topics/energy/repowereu_en (Accessed: 14 July 2026).
Food and Agriculture Organization of the United Nations (2026a) FAO: Middle East Conflict Agrifood Implications. Available at: https://media.un.org/unifeed/en/asset/d354/d3545283 (Accessed: 26 May 2026).
Food and Agriculture Organization of the United Nations 2026b. Risk of Famine Persists as Nearly 19.5 Million People Face Acute Food Insecurity in Sudan. UNICEF.
Gulati, A. and Juneja, R. (2025) ‘Reforming the fertiliser subsidy demands political courage, offers high rewards’, The Indian Express, 22 December 2025. Available at: https://indianexpress.com/article/opinion/columns/reforming-the-fertiliser-subsidy-demands-political-courage-offers-high-rewards-10432161/ (Accessed: 30 June 2026).
ICIS (2023) Canpotex’s Surprise China Potash Supply Contract Splits MOP Market. Available at: https://www.icis.com/explore/resources/news/2023/06/06/10893543/canpotex-s-surprise-china-potash-supply-contract-splits-mop-market/.
India. Ministry of Chemicals and Fertilizers, Fertilizers, M.o.C.a. (2024) Urea is provided to the farmers at a statutorily notified Maximum Retail Price (MRP) irrespective of the cost of production; The subsidized MRP of 45 kg bag of urea is Rs.242 per bag. New Delhi: Press Information Bureau (PIB), Government of India.
India. Ministry of Finance. Press Information Bureau, Bureau, I.M.o.F.P.I. (2026) Highlights of Union Budget 2026-27. New Delhi: Press Information Bureau, Government of India.
Integrated Food Security Phase Classification (IPC) (2026) IPC Sudan Acute Food Insecurity Feb2026-Jan2027 Special Report, Rome. Available at: https://www.ipcinfo.org/fileadmin/user_upload/ipcinfo/docs/IPC_Sudan_Acute_Food_Insecurity_Feb2026_Jan2027_Special_Report.pdf (Accessed: 26 June 2026).
Integrated Food Security Phase Classification (IPC) (n.d.) Famine Facts. Available at: https://www.ipcinfo.org/famine-facts/en/ (Accessed: 19 June 2025).
International Energy Agency (2026) Strait of Hormuz: Factsheet: International Energy Agency. Available at: https://iea.blob.core.windows.net/assets/c8248eba-8689-46d9-ae4b-b858b59c0f1c/StraitofHormuz2026-Factsheet.pdf (Accessed: 27 May 2026).
Itafos Inc. 2026. Itafos and Rio Tinto Amend Sulfuric Acid Contract to Further Support American Farming.
Kee, J., Cardell, L. and Zereyesus, Y. A., Economic Research Service, U.S.D.o.A. (2023) Global Fertilizer Market Challenged by Russia’s Invasion of Ukraine.
Lennon, S. (2025) ‘Brasil importa 45,5 milhões toneladas de fertilizantes em 2025’, Companhia Nacional de Abastecimento, Conab. Available at: https://www.agrolink.com.br/noticias/brasil-importa-45-5-milhoes-toneladas-de-fertilizantes-em-2025_510211.html (Accessed: 17 July 2026).
Liboreiro, J. (2025) ‘Russia’s demand for sanctions relief thrusts the EU into the talks, with tough choices’, Euronews, 26 March 2025. Available at: https://www.euronews.com/my-europe/2025/03/26/russias-demand-for-sanctions-relief-thrusts-the-eu-into-the-talks-with-tough-choices (Accessed: 14 July 2026).
Malheiros, G. (2026) ‘Russia, Brazil’s Largest Fertilizer Supplier, Halts Ammonium Nitrate Exports for One Month’, DatamarNews, 24 March 2026. Available at: https://datamarnews.com/noticias/russia-brazils-largest-fertilizer-supplier-halts-ammonium-nitrate-exports-for-one-month/ (Accessed: 18 July 2026).
Malpass, D. (2022) ‘A transformed fertilizer market is needed in response to the food crisis in Africa’. Available at: https://blogs.worldbank.org/en/voices/transformed-fertilizer-market-needed-response-food-crisis-africa 2026].
McDonald and Jeffrey (2026) Sulfur, nitrogen markets under pressure as Middle East war persists. S&P Global Energy: S&P Global. Available at: https://www.spglobal.com/energy/en/news-research/latest-news/agriculture/031926-sulfur-nitrogen-markets-under-pressure-as-middle-east-war-persists-analysts (Accessed: 27 May 2026).
Mineral commodity summaries 2026 (2026) [Report], Reston, VA (2026. Available at: https://pubs.usgs.gov/publication/mcs2026.
PRS Legislative Research (2022) Union Budget 2022-23: Analysis of Expenditure by Ministries. New Delhi: PRS Legislative Research. Available at: https://prsindia.org/files/budget/budget_parliament/2022/Union%20Budget%202022-23%20Analysis%20of%20Major%20Demands.pdf (Accessed: 2 July 2026).
Rajendra Jadhav (2022) ‘Discounts lift Russia’s fertilizer exports, becomes top supplier to India’, Reuters, 21 Nov. Available at: https://theprint.in/india/discounts-lift-russias-fertilizer-exports-becomes-top-supplier-to-india-sources/1228009/ (Accessed: 13 July 2026).
Revell, J. (2026) ‘A “massive opportunity”: Global supply shocks reveal need to rethink food security’, SBS News. Available at: https://www.sbs.com.au/news/article/a-massive-opportunity-global-supply-shocks-reveal-need-to-rethink-food-security/z8v996k0z (Accessed: 24 August 2026).
Samora, R. (2026) ‘Entrega de fertilizantes no Brasil sobe 7,7% em 2025 para recorde de 49,1 mi t, diz Anda’, Reuters. Available at: https://www.noticiasagricolas.com.br/noticias/agronegocio/416412-entrega-de-fertilizantes-no-brasil-sobe-77-em-2025-para-recorde-de-491-mi-t-diz-anda.html (Accessed: 17 July 2026).
Statista (2025) ‘Leading fertilizer importing countries worldwide in 2024, based on value’. Available at: https://www.statista.com/statistics/1278061/import-value-fertilizers-worldwide-by-country/ (Accessed: 30 June 2026).
The Mosaic Company (2025) 2024 Annual Report on Form 10-K, Washington, D.C.: U.S. Securities and Exchange Commission. Available at: https://www.sec.gov/Archives/edgar/data/1285785/000161803425000003/mos-20241231.htm (Accessed: 28 May 2026).
The Wire Staff (2026) ‘War on Iran Makes the US India’s Lead LNG Supplier’, The Wire. Available at: https://m.thewire.in/article/energy/india-lng-imports-us-share-increase-qatar-decrease-west-asia-crisis/amp (Accessed: 1 July 2026).
Trading Economics (2026) Brent Crude Oil. Available at: https://tradingeconomics.com/commodity/brent-crude-oil (Accessed: 26 May 2026).
U.S. Energy Information Administration (2026) Short-Term Energy Outlook. Available at: https://www.eia.gov/outlooks/steo/ (Accessed: 26 May 2026).
U.S. Geological Survey (2025) Mineral Commodity Summaries 2025: Sulfur. Available at: https://pubs.usgs.gov/periodicals/mcs2025/mcs2025-sulfur.pdf (Accessed: 29 May 2026).
UN Trade and Development (2026) Strait of Hormuz Disruptions: Implications for Global Trade and Development, Geneva. Available at: https://unctad.org/system/files/official-document/osgttinf2026d1_en.pdf (Accessed: 19 June 2026).
United Nations Conference on Trade and Development (2026) From Gas to Grain: Fertilizer Disruptions Raise Risks for Food Security and Trade. Available at: https://unctad.org/news/gas-grain-fertilizer-disruptions-raise-risks-food-security-and-trade.
Wani, S. and Kothari, H. (2026) ‘Iran war bites: Fertilizer ministry seeks doubling of subsidy to Rs 3.4 lakh cr’, Forbes India, 9 June 2026. Available at: https://www.forbesindia.com/article/news/west-asia-war-likely-to-double-indias-fertilizer-subsidy-bill-in-fy27/2994806/1 (Accessed: 2 July 2026).
White, E. 2026. Nutrien Expects Higher Potash Demand Despite Tough Conditions for Farmers. In: Reuters (ed.). Reuters.
Whitelaw, A. (2026) Middle East War Threatens Australia’s Fertiliser Supply. Episode 3: Episode 3. Available at: https://episode3.net/inputs/middle-east-war-threatens-australias-fertiliser-supply/ (Accessed: 24 August 2026).
World Bank (2024) ‘India Fertilizers imports by country, 2024’. Available at: https://wits.worldbank.org/trade/comtrade/en/country/IND/year/2024/tradeflow/Imports/partner/ALL/product/31 (Accessed: 30 June 2026).
World Bank (2026a) Commodity Markets Outlook: Pink Sheet: World Bank Group26 May). Available at: https://www.worldbank.org/en/research/commodity-markets.
World Bank (2026b) ‘Employment in agriculture (% of total employment) (modeled ILO estimate) – Sub-Saharan Africa’. Available at: https://data.worldbank.org/indicator/SL.AGR.EMPL.ZS?locations=ZG (Accessed: 27 June 2026).